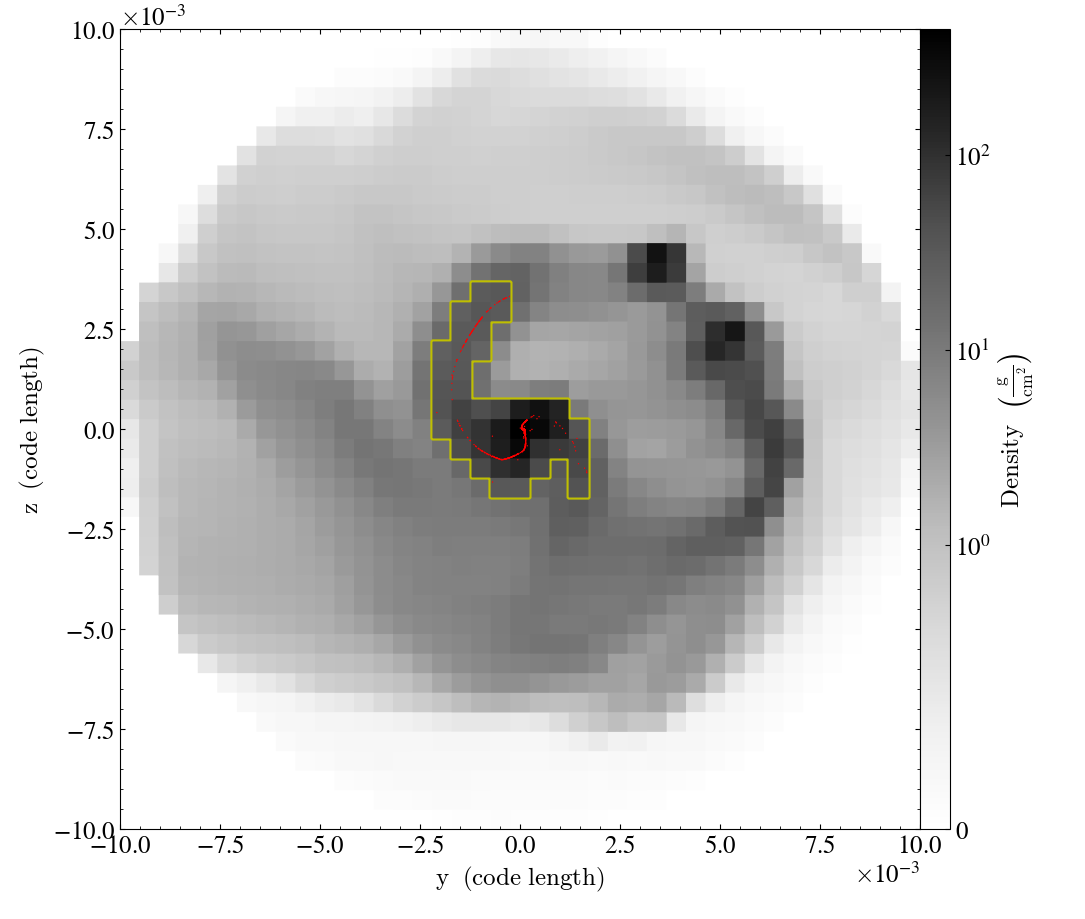
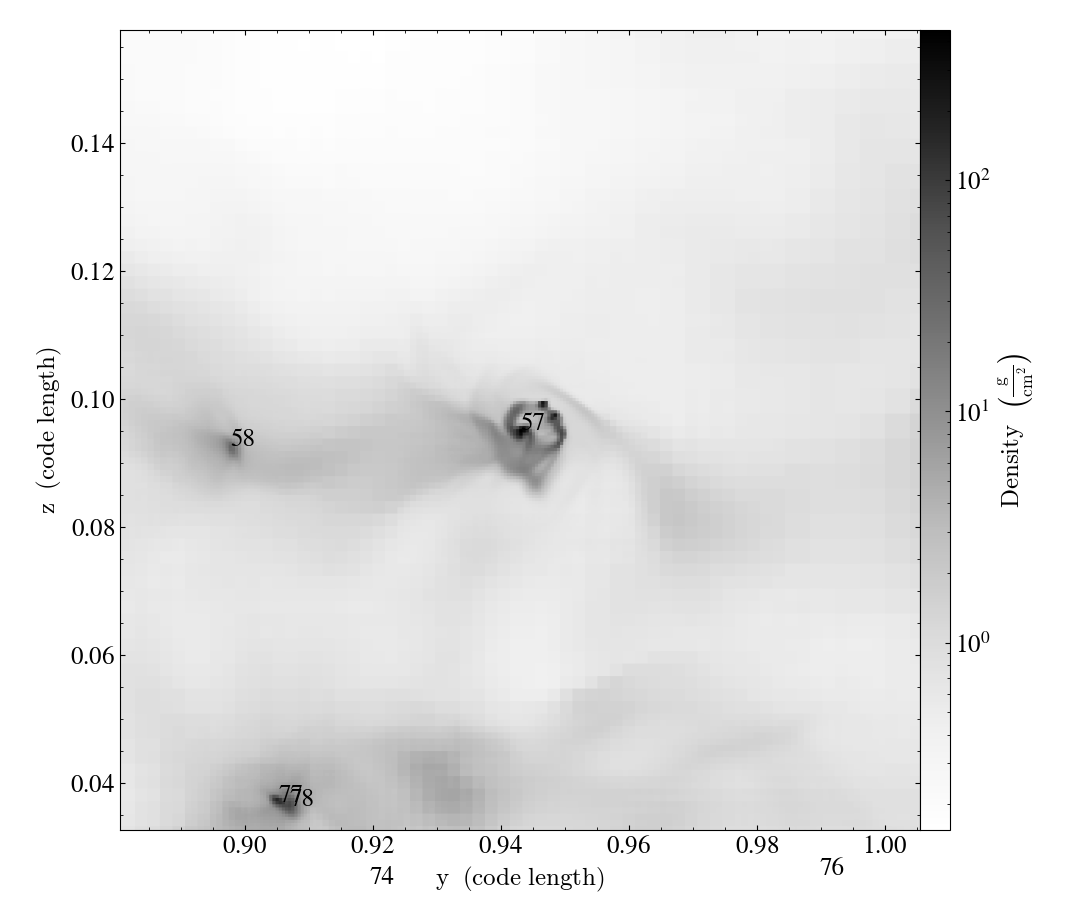
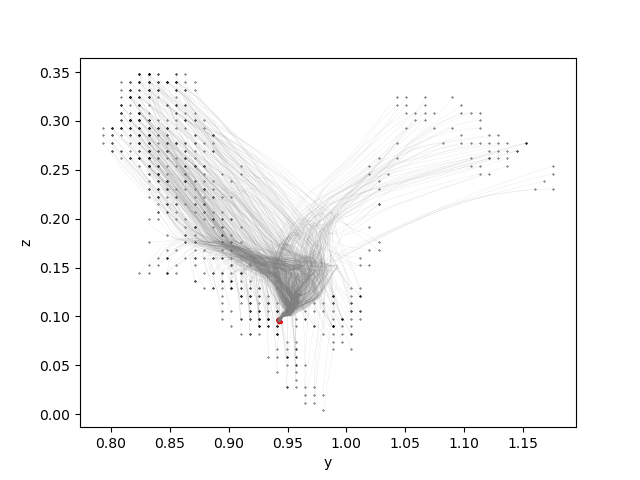
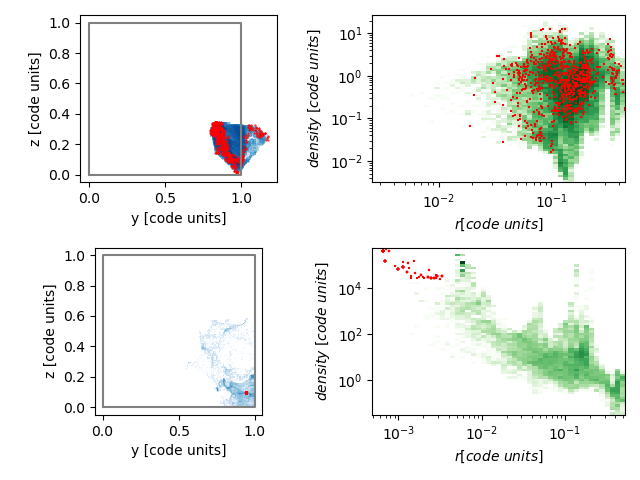
| Captions | The Peak Density | Number of Particles. | Neighborhoods are defined by cores with overlapping preimages. | Cores form Alone, in Binaries (Bn) or in clusters (Cn) | The core and its tracer particles (red). The yellow contour only serves to locate the particles. 32x zoom. | The core and its friends. 8x zoom. | Path lines. The particles begin at the black points and end on the red ones. The preimage is defined by positions at the start. | Movies of projections of density along 3 axes. This core is green, other nearby cores are in red and orange. Projections along X, Y, and Z are seen. | The Other Ones. Particles that do not end in dense cores, but begin near particles that do. The top row is t=0, the bottom row is t=tfinal. The left column is the spatial extent, and the right column density vs. radius. The blue (green) points initially fill the convex hull defined by the initial particle position. |
|---|